Most homeowners glance at their energy bill, wince at the total, and move on. But buried inside that statement is a detailed diagnostic report about your home’s thermal performance. Spikes in kilowatt-hours during mild weather, a steadily climbing baseline usage year over year, or a heating bill that doubles your neighbor’s for a similarly sized house are all signs that your insulation may be failing its one job: keeping conditioned air inside where it belongs.
Poor insulation costs American homeowners an average of 15 to 25% more on heating and cooling each year, according to the U.S. Department of Energy. That translates to $200 to $600 annually for a typical home, money that quite literally disappears through your attic, walls, and crawl space. The frustrating part is that most people assume their bills are just “what it costs” without realizing a fixable problem is driving them up.
This post will walk you through exactly how to read your energy bill like a building scientist, which numbers matter, how to calculate your home’s energy intensity, and how to build a month-by-month picture that points directly at insulation gaps. You will also find two practical action plans, from a free 30-minute bill audit you can do tonight to a more thorough DIY investigation that narrows down which part of your home is underperforming.
What You’ll Need
Click on an item below to shop for the recommended items for this recipe on Amazon.
As an Amazon Associate, we earn from qualifying purchases.
How to Do It
- Gather 12 to 24 months of energy bills or log in to your utility’s online account and download usage history as a spreadsheet or PDF. You need monthly kWh (electric) or therms (gas) figures, not just dollar amounts, because rates change and will distort comparisons.
- Find your base load by identifying the two or three lowest-usage months of the year, typically May and October when neither heating nor cooling is running. Average those months to establish your baseline consumption that is not weather-driven.
- Calculate your weather-sensitive load for each winter and summer month by subtracting your base load from that month’s total. Write these numbers in a simple table: Month, Total Usage, Base Load, Weather Load.
- Look up your local Heating Degree Days (HDD) and Cooling Degree Days (CDD) for each billing month using the NOAA Climate Data Online tool or your utility bill if it prints them. Divide your weather-sensitive load by the degree days for that month to get a normalized usage ratio.
- Compare the same normalized ratio across years for the same month. A ratio rising 10% or more year over year, with no major appliance additions, strongly suggests insulation degradation or settling. Flag months where your ratio is significantly higher than your lowest recorded year.
- Check your cost-per-degree-day figure against regional benchmarks. The EIA reports that a well-insulated 2,000-square-foot home typically uses 0.3 to 0.6 therms per HDD. If you are above 0.8, insulation improvement is almost certainly your highest-ROI upgrade.
- Use your bill audit results to identify which season drives the biggest anomaly: high winter costs point to heat loss (attic and basement priority), high summer costs point to heat gain (attic and west-facing walls priority). This tells you where to physically inspect first.
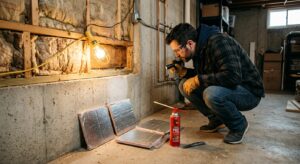
- On a cold day when the outdoor temperature is at least 20 degrees Fahrenheit below indoor temperature, use an infrared thermometer to scan interior ceiling surfaces, wall corners, and exterior-facing walls. Readings more than 3 to 5 degrees below your room air temperature indicate areas of heat loss and likely insulation gaps.
- Go into your attic and measure the insulation depth with a ruler. DOE recommends R-38 to R-60 for most U.S. climate zones, which translates to 10 to 16 inches of blown fiberglass or 13 to 20 inches of cellulose. Note any areas where insulation is thin, compressed, or wet.
- Inspect your basement or crawl space rim joists: the band of framing where your floor system meets the foundation wall. These are among the most under-insulated spots in most homes and account for up to 15% of total heat loss. Look for bare wood or thin fiberglass batts that have fallen out.
- Plug a smart energy monitor or plug-in power meter into your HVAC system’s dedicated outlet if accessible, or use your utility’s smart meter data if available, to measure how many hours per day your furnace or AC is actually running. Compare that to typical runtimes for your climate: a well-insulated home in Climate Zone 5 should need roughly 8 to 12 hours of furnace runtime on a 20-degree day, not 16 to 20.
- Compile your findings into a simple priority list: rank each problem area by the combination of severity (temperature delta or insulation depth deficit) and ease of access. Attic air sealing and insulation top-up is almost always the highest ROI first step, with payback periods of 1 to 3 years for most homeowners.
- Call your utility company first and ask whether they offer free or subsidized energy audits. Many utilities cover 50 to 100% of audit costs for customers who meet usage thresholds, and your high bills may qualify you automatically.
- Request a blower door test as part of the audit. This depressurizes your home to 50 pascals and measures total air leakage in ACH50 (air changes per hour). A well-sealed home should score below 5 ACH50; older leaky homes often score 10 to 20. This single number explains a large portion of your bill anomaly.
- Ask the auditor to use an infrared camera during the blower door test. Depressurization makes thermal defects dramatically more visible, and the camera will show exactly which wall cavities, attic bypasses, or basement rim joists are missing or have failed insulation.
- Review the auditor’s written report carefully. Legitimate auditors provide a prioritized improvement list with estimated savings, installation costs, and simple payback period for each measure. Insulation upgrades with payback under 4 years should be your first investment.
- Use the audit report to apply for utility rebates and federal tax credits before starting any work. The 25C federal tax credit covers 30% of insulation and air sealing material costs up to $1,200 per year, and stacking this with a utility rebate can reduce your out-of-pocket cost by 40 to 60%.
Why It Works: The Benefits
Instead of spending money on generic upgrades, bill analysis pinpoints whether your attic, basement, or walls are the primary culprit, so every dollar you invest in insulation goes to the highest-impact location. Homeowners who address the correct zone first typically recover costs 40 to 60% faster.
Once the diagnosed insulation problem is fixed, the DOE reports typical savings of 15 to 25% on heating and cooling, translating to $200 to $600 per year for a median U.S. home spending $1,400 to $2,000 annually on energy.
A sudden unexplained spike in winter energy use can signal that insulation has been compressed or displaced by water intrusion or rodent activity, problems that cost far more to fix if left undetected for another full season.
Many utility companies offer rebates of $0.10 to $0.25 per square foot for added attic insulation, and documenting your pre-upgrade usage baseline is often required to qualify and maximize the rebate amount.
Correcting the insulation zones identified by your bill audit typically eliminates cold spots and drafty rooms, reducing the temperature swing between rooms from 5 to 10 degrees down to 2 to 3 degrees in most cases.
💰 Savings Impact by Action
Upgrading attic insulation to R-38 or higher reduces heating and cooling loads by 15 to 25% according to DOE data, with the exact savings depending on your starting R-value.
Professional air sealing of bypasses and penetrations reduces whole-home energy use by 10 to 20% by stopping stack-effect-driven air exchange.
Insulating and air sealing basement rim joists addresses up to 15% of total heat loss in two-story homes and typically costs $200 to $600 DIY.
Injection foam or blown-in insulation in empty wall cavities reduces wall heat loss by 40 to 70%, contributing 10 to 15% to overall home energy savings.
Simply identifying and correcting thermostat schedules and behavioral patterns discovered during a systematic bill review saves 5 to 10% with zero investment.
🏠 Key Concepts Explained
The Science Behind It
Heat always flows from warm areas to cold ones, and the rate at which it moves through your walls, ceiling, and floor is governed by thermal conductivity. Insulation works by trapping millions of tiny air pockets that resist this conductive heat transfer, measured as R-value. When insulation is thin, compressed, or missing entirely, the effective R-value drops dramatically: fiberglass batts compressed to half their rated thickness lose roughly 40% of their insulating value. This is why your energy bill responds so sensitively to insulation condition, not just insulation presence.
The degree-day normalization method works because it accounts for the outdoor temperature driving force behind your energy use. On a day when it is 30 degrees outside and you want 70 degrees inside, there is a 40-degree difference pushing heat out through every surface of your home. A home with R-38 attic insulation loses heat through that surface at roughly half the rate of a home with R-19, meaning the furnace has to run twice as long to compensate. Plotting your weather-normalized energy consumption over time essentially builds a graph of your home’s thermal resistance, and any downward trend in effective R-value shows up as an upward trend in your normalized usage ratio.
The stack effect adds another layer: warm air in your living space is less dense and rises, creating slight positive pressure near the ceiling and negative pressure near the floor. In a leaky home, this pressure difference drives warm air out through attic bypasses and pulls cold air in through basement gaps in a continuous loop. This convective loss is separate from and additive to conductive loss through insulation, and it explains why homes with seemingly adequate insulation depth still show poor energy performance when attic bypasses around recessed lights, plumbing chases, and partition walls have never been sealed.
Frequently Asked Questions
▼ My bill went up a lot this winter but my neighbors say theirs barely changed. Is that definitely insulation?
Not necessarily by itself, but it is a strong signal. First rule out HVAC causes: a dirty furnace filter, failing heat exchanger, or a duct leak can increase heating costs by 15 to 25% without any change to insulation. Replace the filter, schedule a furnace tune-up, and check that all supply registers are open. If costs remain elevated after those fixes, proceed with the bill audit and physical inspection steps in this post to evaluate insulation.
▼ My home was reinsulated 10 years ago. Can insulation really degrade that fast?
Yes, under certain conditions. Blown fiberglass and cellulose can settle 10 to 20% in the first few years, reducing effective R-value. More significantly, a single roof leak, plumbing drip, or bathroom exhaust fan venting into the attic can saturate insulation within months, collapsing it and fostering mold. Look for water stains on attic sheathing and feel insulation in multiple locations for dampness. Wet insulation can have near-zero effective R-value despite looking intact.
▼ How do I find Heating Degree Days for my specific location?
Go to the NOAA Climate Data Online portal at climate.gov and search for your nearest weather station. You can pull monthly HDD and CDD data going back decades at no cost. Many utility bills also print local degree days directly on the statement. If your bill includes a usage comparison chart normalized to weather, use those figures directly since they are already adjusted for your billing cycle dates.
▼ I rent and cannot add insulation. Can this approach still help me?
Absolutely. Run the bill audit to document the problem clearly with numbers, then present your findings to your landlord in writing. Showing a 30% above-average energy intensity compared to similar homes gives your landlord concrete evidence that an investment in insulation will also reduce tenant turnover. In some states, landlords are legally required to maintain habitability standards that include minimum thermal performance, so check local tenant energy code rights.
▼ My bill analysis shows high summer costs but my attic insulation looks fine. What else could it be?
Summer heat gain has two main paths: conduction through insulation and solar radiation through windows and roof. Check whether your attic has proper ventilation since a poorly ventilated attic can reach 150 to 160 degrees Fahrenheit and overwhelm even good insulation. Also look at west and south-facing windows: unshaded double-pane windows can add the equivalent of a 100-watt space heater per window during peak afternoon sun. Adding exterior shading or low-e window film costs $30 to $100 per window and can reduce solar heat gain by 40 to 70%.
Quick Tips
- Download your utility’s usage data as a CSV file if available so you can sort and calculate in a spreadsheet instead of doing math by hand.
- Compare your normalized energy use to neighbors with similar home sizes using your utility’s neighborhood comparison tool if available. A difference of 20% or more above average strongly suggests an insulation or air sealing problem rather than just behavior.
- Check whether your thermostat settings or schedules changed in the year when your usage started rising. Rule out behavioral changes before concluding that insulation is the cause.
- If your utility bill shows both electric and gas usage, track them separately since a gas furnace and electric AC will each spike in different seasons, giving you two separate data streams to diagnose heating versus cooling losses.
Variations for Your Situation
- Apartment or Rental: Renters cannot access attic or wall cavities, but the bill audit method works the same way. Focus on documenting your usage-per-square-foot compared to regional averages and share the written findings with your landlord. In the meantime, apply window insulation film ($15 to $30 per window), use heavy curtains with thermal lining on north-facing windows in winter, and place draft stoppers at exterior door thresholds. These renter-safe steps typically reduce heating costs by 5 to 10% at minimal cost.
- Tight Budget (under $50): Focus entirely on the free bill audit first to confirm the problem before spending anything. If the audit points to air leakage as the primary driver, buy one can of expanding foam sealant ($8 to $12) and one roll of weatherstripping ($10 to $15) and tackle attic hatch edges, basement rim joist gaps, and exterior door frames. These three spots alone often account for 30 to 40% of total air leakage in older homes and cost less than $30 to address.
- Older Home (pre-1980): Homes built before 1980 frequently have original wall insulation that has settled or was never installed uniformly, and attic insulation well below current code minimums of R-38 to R-60. Your normalized usage ratio will almost certainly be above regional averages. Before investing in new insulation, have the existing material tested if there is any loose gray or silver granular material in the attic, as vermiculite insulation from this era may contain asbestos and requires professional abatement. Budget $500 to $2,000 for abatement if found, then proceed with insulation upgrades using a certified contractor familiar with older construction details.